My trusty and sophisticated weather station finally declined to a point where it was not economically viable to replace the worn out parts. A much more sophisticated unit was available that also had web update capability. So this page now shows what the first weather station looked like and the trouble I had to go to in order to be able to present its data here for you to enjoy.
This page is now a historical static record. The new weather station page can be found here.
Introduction | Weather Station Data | Weather Graphs | Sky Met | The Weather Station | Macro Express
As a private pilot I always have an eye on the weather. To help with this I have a fairly sophisticated weather station with a data logger that collects statistics every 5 minutes and can accommodate several years worth of data. I download this data regularly to a database from which various analyses are possible.
I have been working on a way of connecting the weather station and its data logger directly to this site so that I can view it remotely (say using my smart phone's browser).
I did succeed in doing this, as described below, but due to the way in which my various computer systems are being used it is no longer practical to run the daily update so this page is updated only on an ad-hoc basis now - often at 2:30pm weekdays.
I am using a product known as Macro Express to automatically run the weather station's software to download data from the logger, capture the weather station data including its current forecast, generate some useful graphs using data over the last 28 days, and upload the weather station images and graphs to this page on a daily basis (provided of course that my PC is running on that day). This data is for Ruddington, Nottingham UK.
So this page is somewhat of an experiment: I am sure there must be some better way to achieve an automatic update of this information but until I find a smoother way of doing so, at least this Macro Express solution seems to work reasonably reliably.
There are many graphs that could be displayed and the ones shown below are just an example.
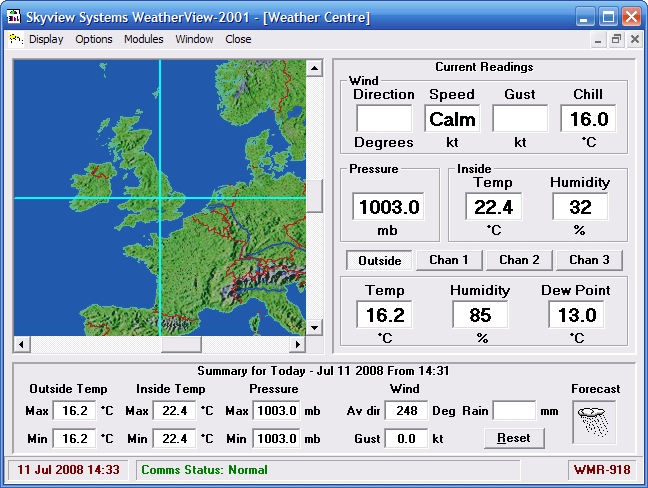
Here is the latest weather display for Ruddington, Nottingham - note the macro that updates this display attempts to do so at 14:30 UK most week days (not weekends) and additional runs are executed manually occasionally. If you are interested in this and would like to see it updated on a more regular basis then please visit my Visitor's Book and make a comment to that effect. I'm considering making the underlying database available online so that graphs could be constructed and displayed interactively on this site - that'd be quite a piece of work to achieve, but again, if you'd be interested in that then do let me know via the Visitor's Book (I get alerts whenever an entry is made into the Visitor's Book).
Over the many years that I have owned this weather station I have had to replace some of the key components: radio transmitter for the rain gauge (they have to be purchased as a pair, hence a new rain gauge was needed too), hygrometer/thermometer (again with its radio transmitter). For a while it looked like I'd also have to replace the weather vane, anemometer and their transmitter which would have meant that I would have had to gradually replace all of the remote sensors apart from the indoor combined barometer, hygrometer/thermometer, and forecaster. However, they unexpectedly started working again and so no immediate maintenance expenditure was needed.
Current status (12-Jul-08):-
| Rain Gauge not working! It appears that its radio transmitter has failed. It's quite expensive to fix as the gauge and the radio transmitter have to be purchased as a pair. | |
| Anemometer highly suspect - only seems to spin in high winds. Unfortunately the anemometer is beyond the help of lubrication - having dismantled it I find the spindle is tainted with rust running down through its bearings and the bearings themselves are no longer running true or smoothly. Further it looks like its radio transmitted has failed too. | |
| Conclusion: the damage in total is beyond economical repair L However I have had this weather station for many years and it has served me really well, so I have ordered the latest model from Oregon Scientific to replace it. I also ordered the advanced software to go with the new weather station and that software seems to offer some significant web capability with auto-upload of weather data so I am looking forward to rebuilding this page based on the new software when it all arrives and I can get it up and running. |
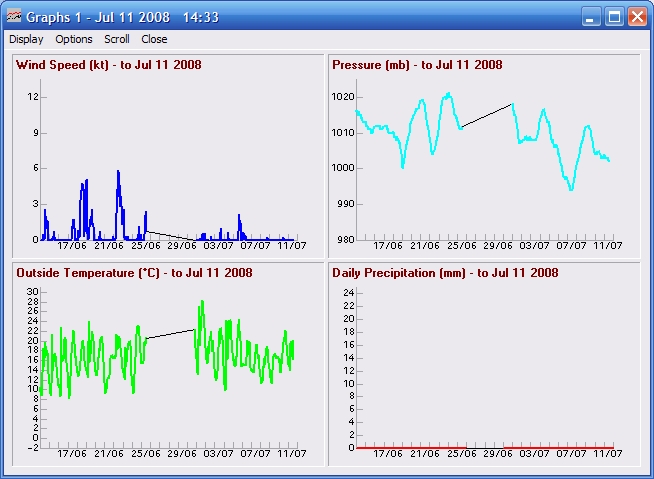
Here are some graphs for Nottingham over the last 28 days. Sometimes for technical reasons data may be lost although it is most unusual for that to happen - and the missing segment is represented by thin black lines joining up the parts of the colour display. (Ironically, having written this, for some reason the black lines do not always appear on the captured image even though they are present in the original). The database behind these graphs covers many years of data going back to the Tsunami and beyond. Sometimes there are gaps in it though. If you wanted to see any particular period graphed then you could contact me via my Visitor's Book and I can do the graphs and put them on an additional "requests" page?
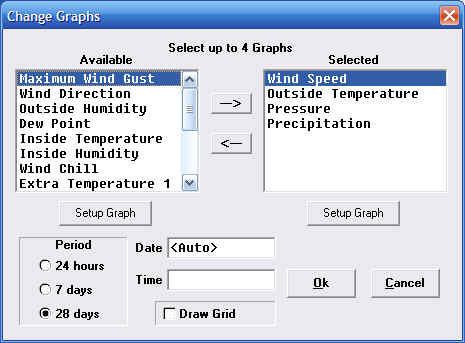
Here captured below is the Graph Setup panel, from the two lists you can see which aspects of the weather can be graphed:-
Macro Express is a very powerful tool with many varied uses. In this instance it does the following:-
| Check and remember if Skymet is running - because it would be tying up the channel to the weather station. If it was running then Terminate Skymet. | |
| Check and remember if Skyview is running - because that too would be tying up the channel to the weather station. If it was running then Terminate Skyview. | |
| Start the Skyview Data Logger software and get it to download all of its data into a database. Terminate the Data Logger. | |
| Start the Skyview software and wait for it to gather data from the Weather Station and produce its forecast. Screen capture the image and store it in my offline web site. | |
| Drive the Skyview menus to get it to produce the graphs (above) using the stored Data Logger data. Screen capture the image of the graphs and store it in my offline web site. | |
| Run up an FTP connection to this site and upload the JPG images. | |
| Start the Skyview Data Logger software again and clear its data bank. | |
| Whilst the Skyview Data Logger is still running, re-send the current Configuration to it. The purpose of this is that its clock is not very accurate and re-sending the Configuration will re-synchronise its clock with the PC's clock. | |
| Terminate the Skyview Data Logger. | |
| If Skyview was running to start with then restart it and finish here leaving it running. Otherwise... | |
| If Skymet was running to start with then restart it. | |
| END. |
Follow this link for further information on Macro Express - excellent product.
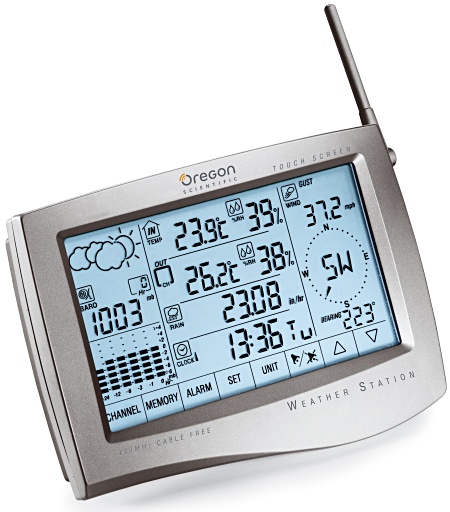 |
The weather station is an Oregon Scientific WMR928N which
has been fitted with a matching Data Logger device and has the following
features:-
More details can be found through this link. |
Skymet is the latest piece of software that I have purchased to go with the weather station.
Skymet is quite an interesting piece of software and I have provided some details on another page here.